Life Expectancy
The objective of this analysis was to obtain a better understanding of the trends and changes in life expectancy over time, as well as to explore the factors that may be associated with variations in life expectancy. By examining important correlations, we can gain a better understanding of the underlying factors that influence changes in life expectancy over time.
Key Steps
1. Data Cleaning
1.1 Dataset / Variable descriptions
To gain insight into the meaning of the variables and what type of variable each is, i.e., nominal, ordinal, interval, or ratio?
1.2 Missing values
It was found that nearly half of the BMI variable's values were null therefore this variable was removed.
There were several other columns with missing values - impututing the missing values with the mean for each year was performed to fill in the missing values while preserving the general trend of the data.
1.3 Outliers
Boxplots and histograms were utilised to visually see outliers. By visual inspection, it was evident that there existed several outliers for all the variables, including the target variable of life expectancy. The application of Tukey's method was used to confirm this statistically - anything beyond 1.5 times the Interquartile Range (IQR) was considered an outlier.
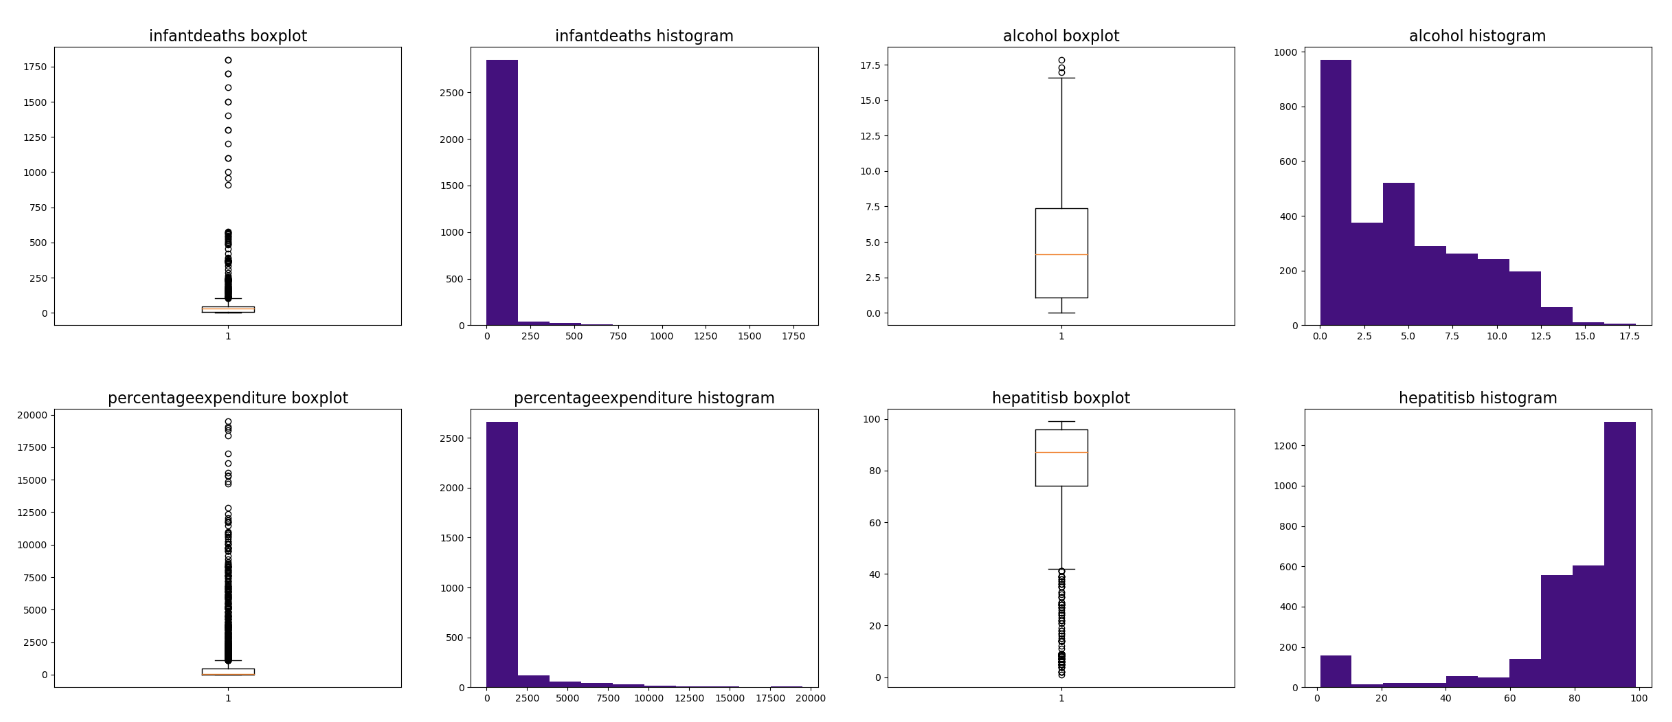
Winsorisations was used restrict the values for each variable until all outliers are eliminated. This technique was used to as small extent as possible in order to keep as much data in tact as possible while still being able to eliminate the outliers.
2. Data Exploration
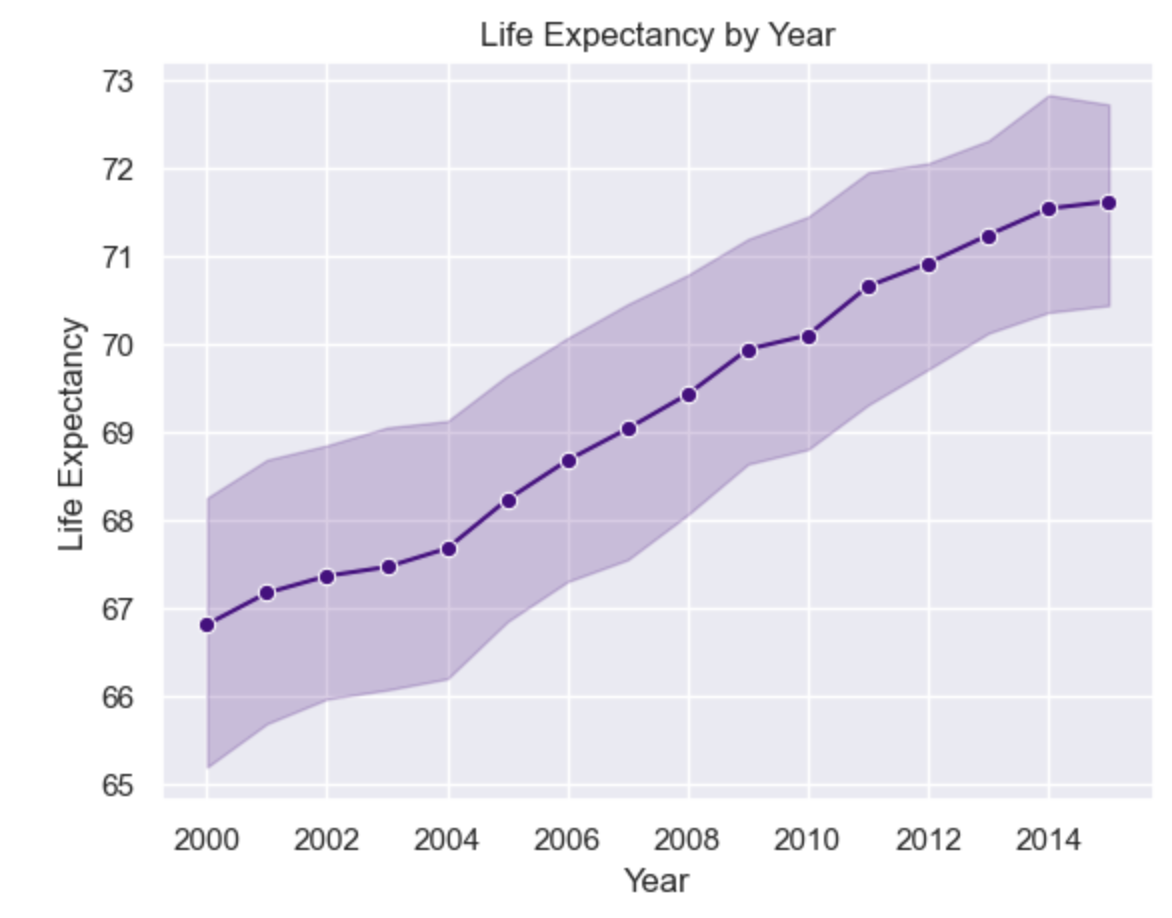
2.1 Life Expectancy over time
Seaborn chart used to gain insight into a positive trend over time with life expectancy increasing gradually year on year.
2.2 Continuous Variable Correlation
Correlation matrix used to gain insight into important correlations.
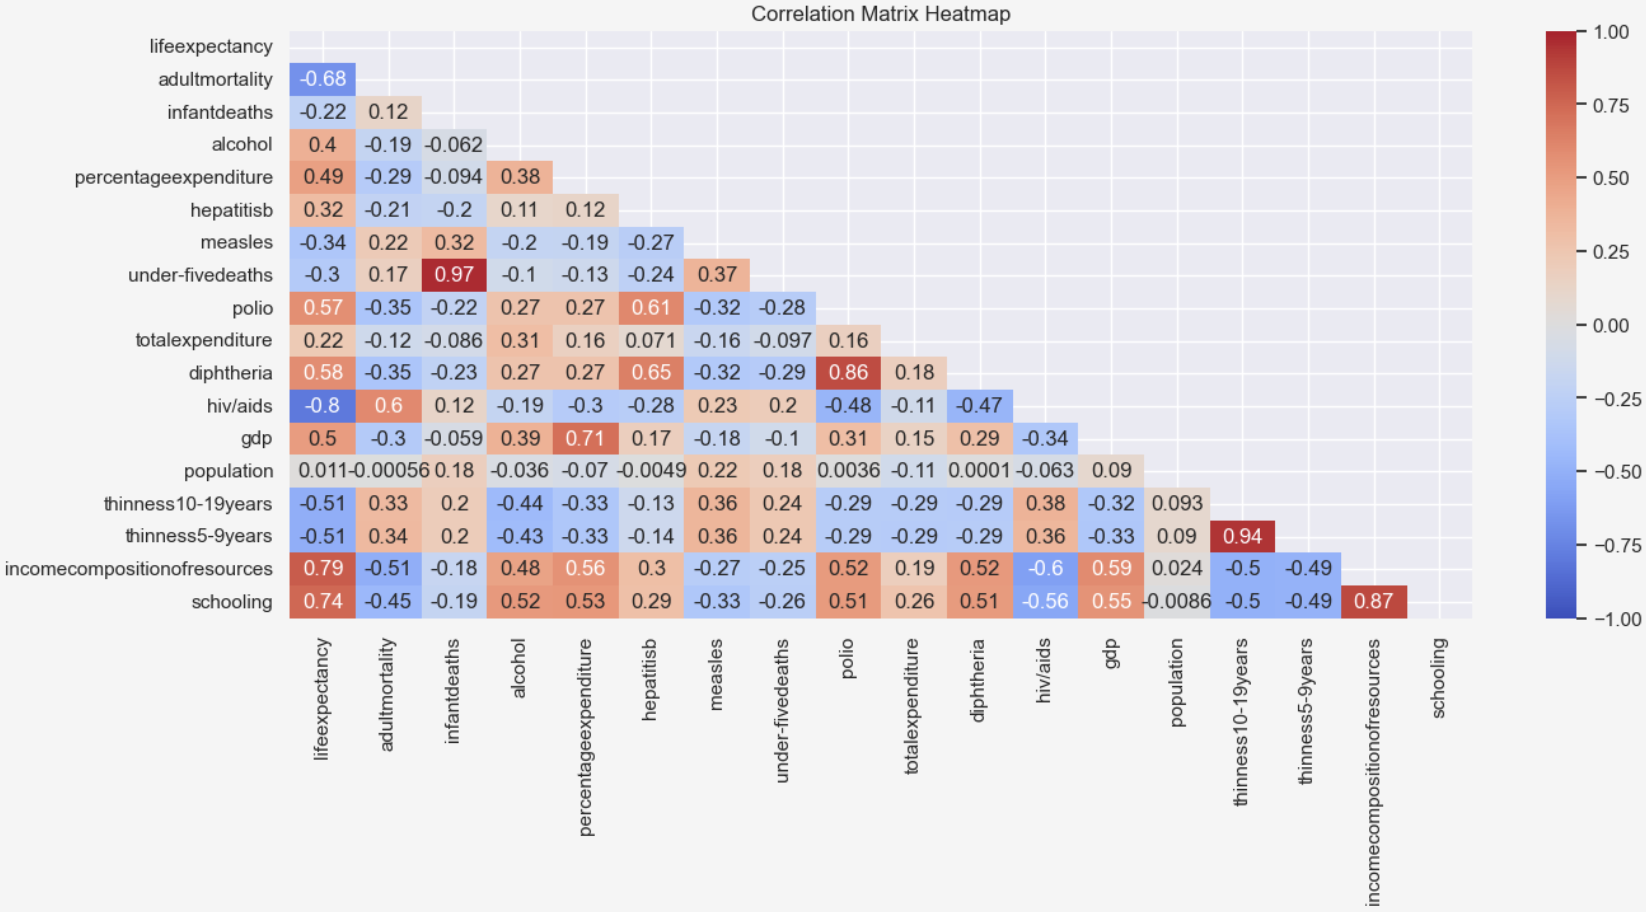
Life Expectancy - target variable - appears to be relatively highly correlated with:
- Adult Mortality: Negative
- HIV/AIDS: Negative
- Income Composition of Resources: Positive
- Schooling: Positive
2.4 Correlation Scatterplots
To view correlation between variables.
Life Expectancy and Years of Schooling
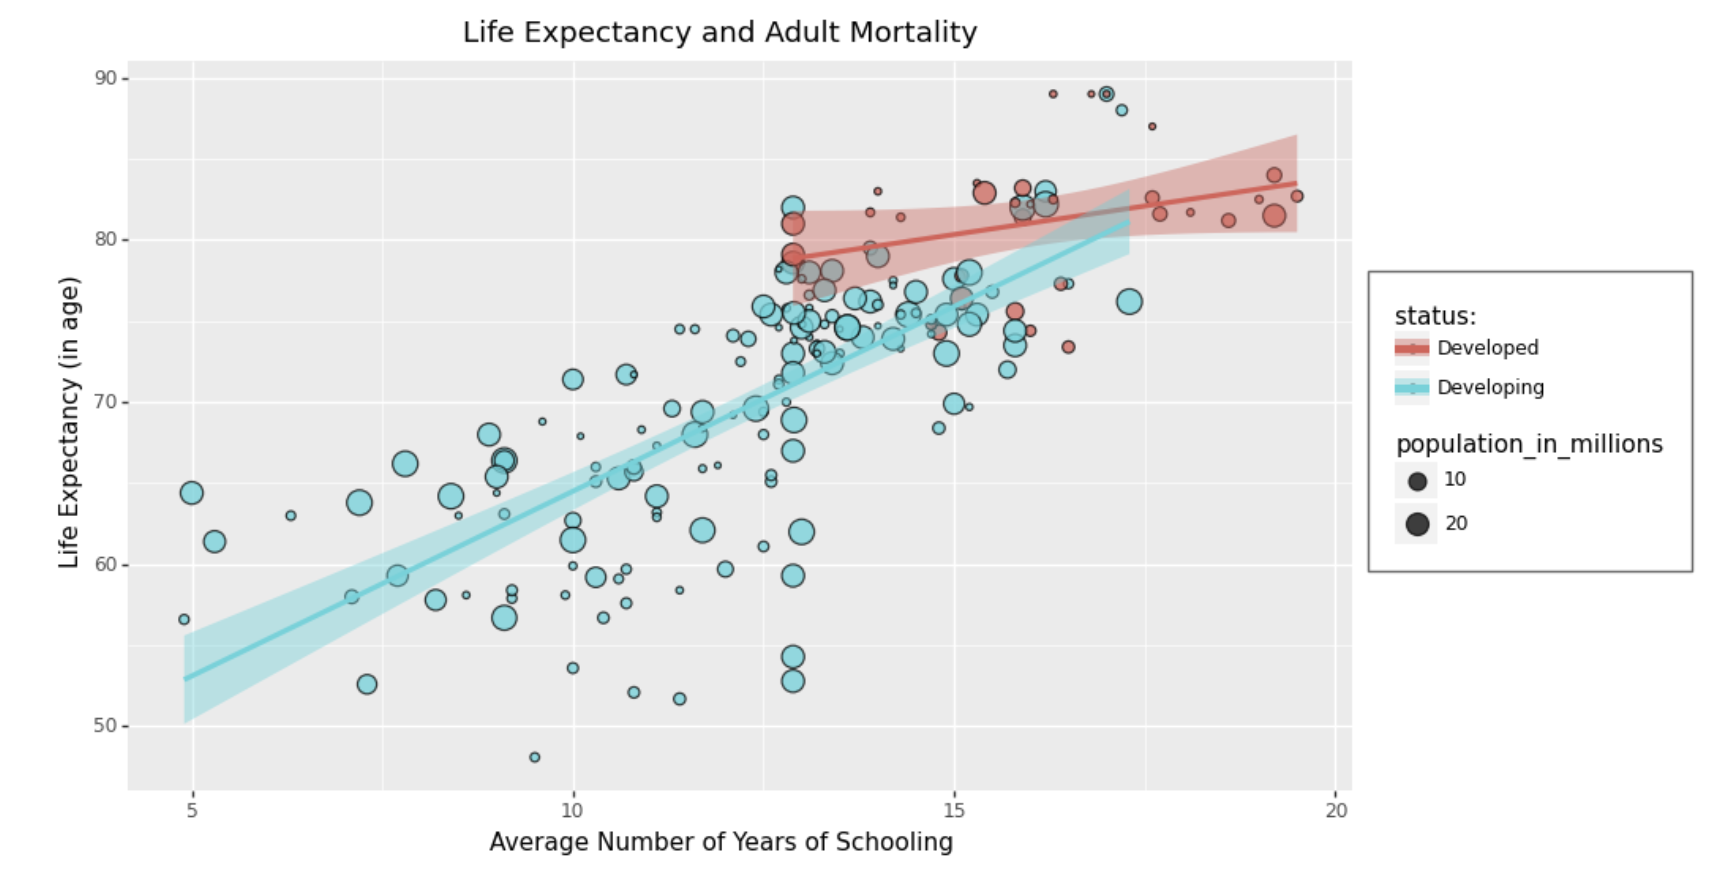
The evidence shows a clear positive correlation between the number of years of education and the average life expectancy, particularly in developing countries. Furthermore, developed countries exhibit notably higher levels of both education and life expectancy in comparison to developing countries.
Life Expectancy and GDP
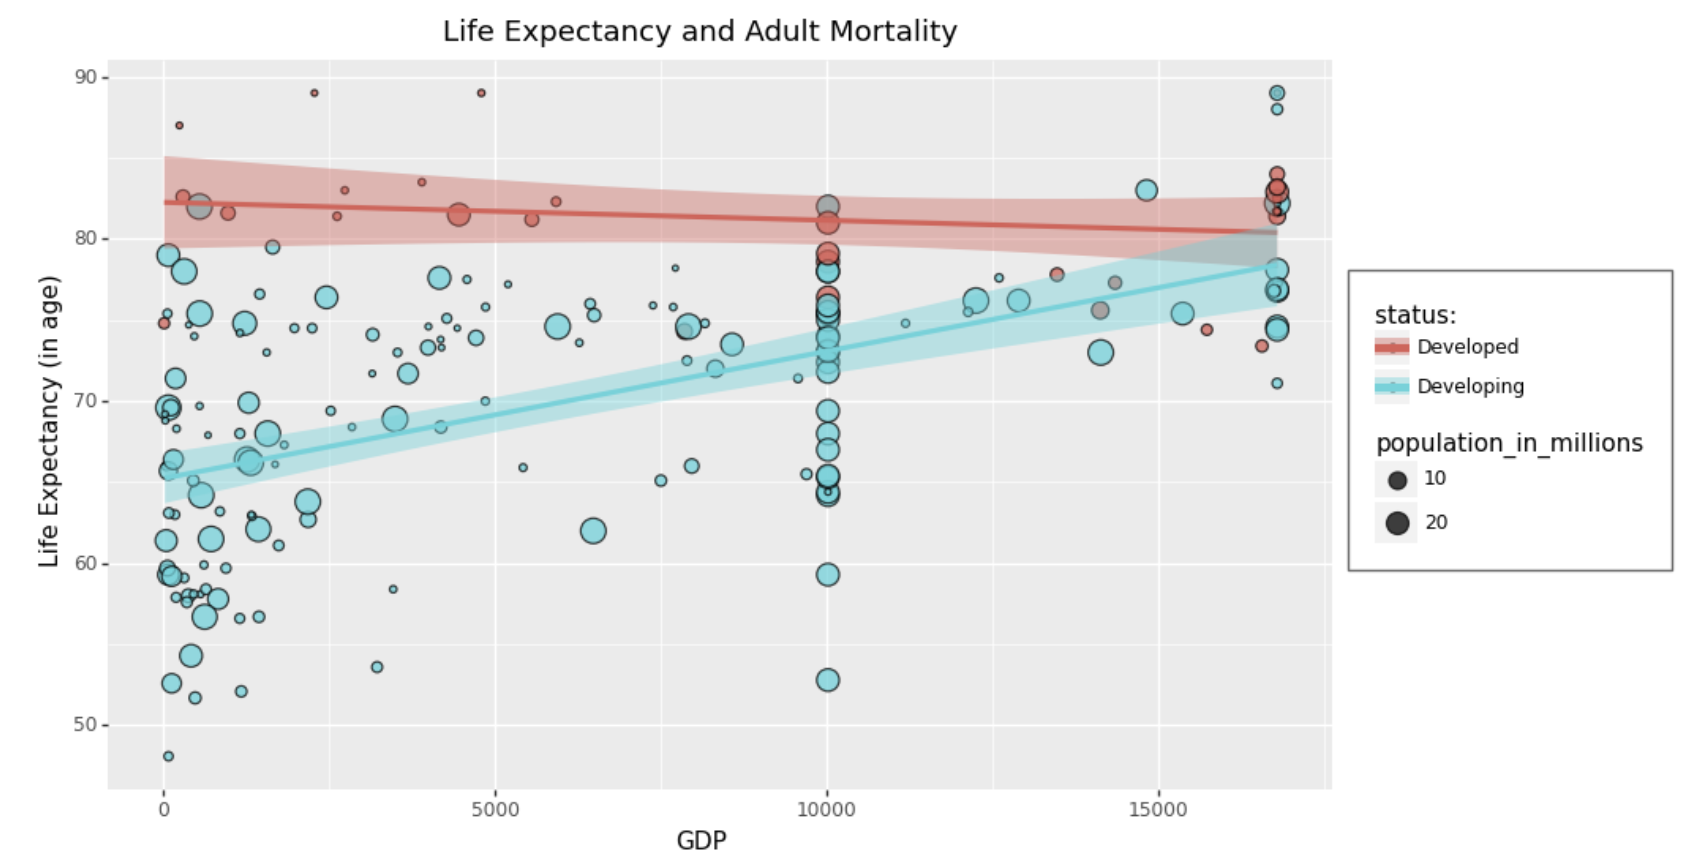
There is a positive correlation between life expectancy and GDP for developing countries. Interestingly, the same correlation is not seen between life expectancy and GDP in developed countries - for these countries the correlation is fairly flat.
Languages
Python: pandas, numpy, matplotlib (pyplot), seaborn, scipy (stats, winsorize), sklearn (PCA, scale), os
You can view the complete Jupyter Notebook below showing the full analysis.